In order to bring the theory to practice we will need to build implementations.
The First Way
Enable On-Demand creation of environments
The sooner a developer can use a production-like system to test his code on, the better. This allows us to detect issues early in the chain instead of during deployment to production.
Creation of these environments should be seamless and completely automated. These environments should be considered as cattle and not as pets. All configuration should be stored in git. If an environment is in a broken state, you simply shoot it down and spin up a new one. All of this should be possible without Ops intervention.
The Deployment Pipeline
A pipeline needs to be put in place that is automatically started with every commit. The pipeline should be considered holy and the whole engineering department should treat them as such. It is completely fine to break them, they exist to prevent defects to reach downstream, it is only logical that it will eventually break. However, whenever it breaks, the teams should stop their work and make sure the build gets fixed. This is a cultural thing.
The pipeline should include the following steps:
- Building the artifact
- Automated unit tests
- Static code analysis
- Duplication and test coverage analysis
- Style checking
- Deployment into production like environment
- Automated acceptance tests
Whatever the artifact is that you build, you only build it once and store it in an artifact repository. You will re-use the same artifact in any other later stages of the deployment pipeline.
Fast and Reliable Automated Test Suite
Tests are a necessity. There are different type of tests that can be written. All of them have value but are used for different purposes.
- Unit tests: Tests a single method, class or function. Checks if the code does what the developer intended it to do.
- Acceptance tests: A functional test to verify that the application does what the user/customer expects it to do.
- Integration tests: Ensures that the application correctly interacts with other applications.
- …
Unit tests are extremely quick and lightweight to run. You want a lot of these and you want to run them very early in your pipeline. Integration tests are also required, but are much more expensive to run.
Whenever you find out that an integration test fails, you should think critically and investigate if it is possible to have found the same defect using a unit test. If the answer is yes, write the unit test.
More extensive tests such as performance or load tests can be run either continually or on a schedule. These should not be part of your pipeline by default, as they often take a long time to complete.
Continuous integration
Long lived feature branches should be avoided. Instead developers should merge their changes at least once a day to the main branch. This allows the automated test suite to be triggered and provides feedback to the developer about the changes he did. By keeping this change set small, it becomes easier to troubleshoot and fix issues in case the tests fail.
Before committing, developers should run unit tests locally. Alternatively this can be automated by using pull requests and merging pull requests daily. The necessary tests to attempt to keep the main branch in a deployable state, can be triggered as part of the pull request.
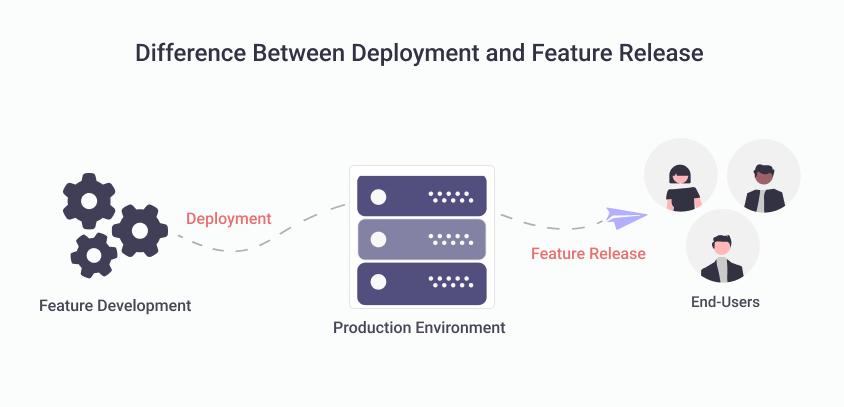
Decoupling deployments from releases
A deployment is when you install a new version of your software. A release is when you make software available to your customers.
In traditional systems they often might mean the same thing. However we should strive to decouple deployments from releases.
Feature toggles can be used to control which features are available to the customer. Enabling or disabling the feature for a (set of) customer(s) is as simple as ‘flicking a switch’.
By increasing the deployments we do to production, we can already test new functionality under ‘real’ load without making the feature available to the end user. This allows us to tweak and tackle issues for days/weeks before the decision is made to make the feature available to the public. This method is often called a ‘dark launch’.
Decoupling deployments from releases also loosens the dependency between the business and development. As the feature is already deployed in production, the only action that needs to be taken is to ‘release’ the feature by enabling the feature toggle to make it available for the customers.
Doing this makes releases a lot less complex, as a release just means enabling a set of feature toggles to make the software available to the public.
Change your architecture if necessary
There is no perfect architecture. An architecture is used to reach certain goals. As the application grows, these goals can and will change. Whenever this happens, the architecture should change to reflect that.
One technique that can be used to change architectures is the “Strangler Fig Pattern”. Using this pattern you put all ‘legacy’ functionality behind an API and stop making any changes to it. New functionality is written using the new architecture. When required the new code can make calls to the legacy code through the API.
Access to services should go through versioned APIs (versioned services/immutable services). This allows us to modify the service without having an impact on the callers. The system will become more decoupled if we handle it that way. When arguments of the API need to be modified, a new API version is created and all services that use it will be migrated over to the latest versions.
Using this pattern, you can slowly convert your architecture step by step, just like a strangler fig takes over its host tree.
The Second Way
Telemetry
In order to verify that our application is running as expected, we have to monitor it. We can do so by collecting telemetry from all our systems that our application interacts with. A centralized telemetry system should be created where all our telemetry can be aggregated.
Logging
Logging is an integral part of any application and is an important part of telemetry as we can convert log lines to metrics. To do so, we have to do this in a standardized way. Use the correct log levels.
| Log level | Description | Example |
|---|---|---|
| DEBUG | Application related, disabled in production and enabled for debugging. | Looping through customers. |
| INFO | User driven events. | User logging in, credit card transaction. |
| WARN | Conditions that could potentially lead to errors. | Database call taking longer than expected. |
| ERROR | Error conditions. | API call fails. |
| FATAL | Program has to be terminated. | Unable to bind to network socket. |
In order to make it easier to interpret these logs, we should create hierarchical categories. This can be done for both non-functional attributes and for attributes related to features.
| Type | Examples |
|---|---|
| Non-functional | security, performance |
| Features | search, ranking, payment |
Creation of telemetry as part of our daily work
Creating new metrics should be made very simple. Both infrastructure and supporting libraries should be created that allows for developers to create new metrics with a single line of code and have them available in a central location. This has been made easier with the introduction of the OpenTelemetry standard, as there is a lot of tooling that supports this standard. By increasing the available metrics, we make it easier to troubleshoot if issues arise.
Accessible dashboards for everyone
Everyone that is part of the value stream has a benefit in viewing these metrics. Access to these dashboards should be self-service. For production telemetry, these dashboards can be displayed in places where Development and Operations work. This allows everyone to see how our services are operating.
Different levels of metrics
Metrics can be defined in different types, depending on what they are tracking. Generally we can split them in the following levels.
| Levels | Example |
|---|---|
| Business | Number of sales transactions, user sign-ups, churn rate |
| Application | transaction times, user response times, application faults |
| Infrastructure | web server traffic, CPU load, disk usage, memory usage |
| Client software | JavaScript on the client browser, errors and crashes, user-measured transaction times |
| Deployment pipeline | Build pipeline status, test suite status, environment promotions |
Telemetry to make deployments safer
When using correct telemetry that indicates how our services are performing, we can overlay each code deployment on these charts. This allows stakeholders to quickly see the impact of their change.
In case of issues, the faulty service can either be rolled back by use of feature toggles, or the issue can be fixed forward. By overlaying code deployments on all dashboards, it becomes very transparent to see what impact a code deployment had on which service.
Developers share rotation duties with operations
Instead of keeping operations isolated with on-call duties, developers should be included in the on-call rotations. By doing this, we prevent recurring issues to be prioritized below new features. A feature can only be considered ‘done’ if it behaves like it is supposed to in production.